Crime in Nantucket, Massachusetts
Major crime in Nantucket is 22% below the U.S. rate per resident: 39% lower for persons crimes and 19% lower for property crimes. Expected major crimes are down 7.4% from a year earlier.
Modeled estimates per resident, not counts of incidents. How we calculated this
Index: crimes per resident compared with the U.S., where 100 is the U.S. rate and 200 is twice it.
Check an address in Nantucket
Intimidation stands out most, at 2.3 times the U.S. rate
Expected crimes per year in Nantucket for each type, and the index against the U.S. rate per resident.
Citywide indexWhere the middle half of residents live
Property crimes
Social disorder
How crime varies across Nantucket
The middle half of Nantucket residents live in neighborhoods with a major-crime index between 29 and 91; the typical (median) resident's is 45. The citywide figure (78) is higher than that because crime concentrates in a smaller set of areas.
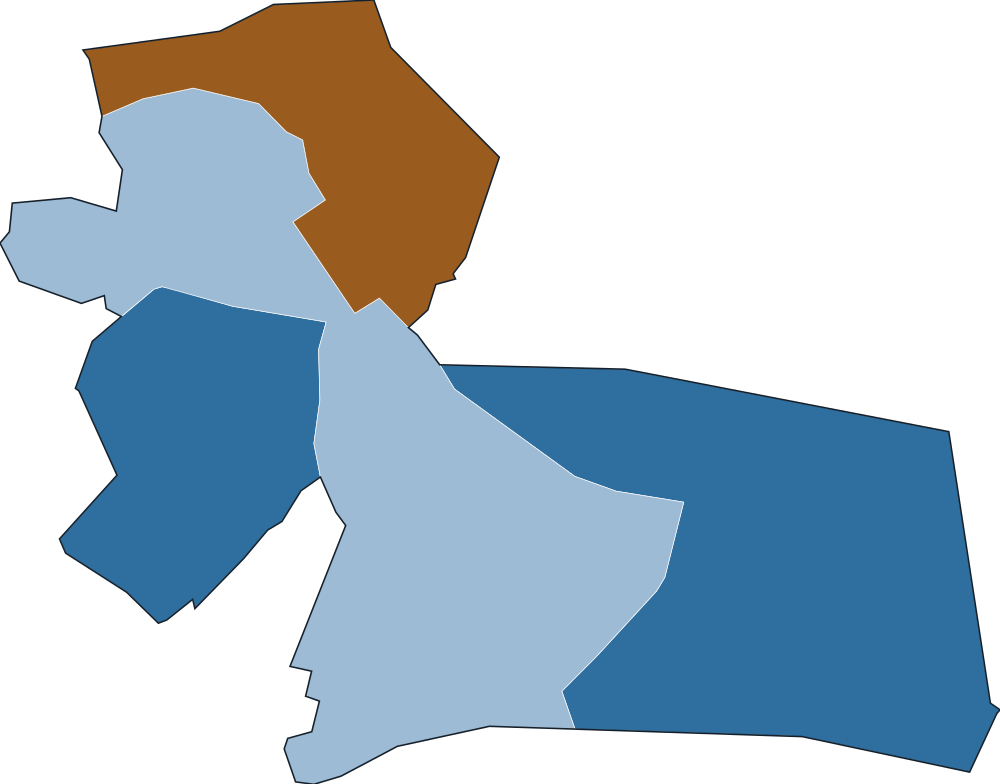
- 0–5058.1%
- 50–10036.8%
- 100–2000.0%
- 200–4000.0%
- 400+5.1%
Share of residents by the index of their census block group, a neighborhood of roughly 600 to 3,000 people.
Highest in the daytime
Major-crime index by time of week, against the U.S. rate for the same hours.
Major crime fell 7.4% in a year; across Massachusetts it fell 5.7%
Change in expected crimes, with Massachusetts as a whole in gray. The past year uses the reporting agencies' year-to-date FBI data; 2031 is the model's projection.
Nantucket against U.S. places with 10,000 to 25,000 residents
988 of the 2,149 other places of this size have a higher major-crime index than Nantucket; the middle of the group is 72. The 9 nearest in population:
Major-crime index per resident, U.S. = 100; residents in gray.
Nantucket has a higher major-crime index than all of its 8 nearest neighbors
The 8 nearest cities and towns we cover, by major-crime index. The closest, West Yarmouth (28 mi), is 9% below Nantucket's rate.
Major-crime index per resident, U.S. = 100; distances between where residents live, in miles.
Questions about crime in Nantucket
What are the most common crimes in Nantucket?
By expected count, the most common persons and property crimes are other larceny (about 93 a year), aggravated assault (about 15 a year) and theft from vehicle (about 9 a year). Compared with the U.S., intimidation stands out most: 2.3 times the U.S. rate per resident.
How we calculated this
Each police agency's crimes, as reported to the FBI, are spread across the census block groups it serves using population, jobs, points of interest and, where available, local incident records. Nantucket's figures add up its 7 block groups. The index compares crimes per resident with the U.S. rate.
- Nantucket's published incident records inform the estimate for every neighborhood.
- 0.0% of residents live in block groups whose estimate has high confidence (80% interval within about 5x).
- Rates are per resident, so places where many people work or visit but few live, such as downtowns, airports and stadiums, can read high.
- Disorderly conduct and trespassing are modeled, because the FBI records them only through arrests.
- Residents: 10,732. Model updated Oct 20, 2026. Release 2026-2026-10-20-2
Full method and validation·Data sources
CrimeMetric. "Crime in Nantucket, Massachusetts." Vorp Labs, model updated Oct 20, 2026. https://crimemetric.com/ma/nantucket
Use these numbers in your product
Any U.S. address by API or MCP, free for 10,000 lookups a month.
Get a free API keyNearest cities we publish
Major-crime index, U.S. = 100
- West Yarmouth28 mi71
- Dennis Port28 mi62
- Harwich Port28 mi44
- South Yarmouth29 mi55
- Barnstable Town30 mi64
- South Dennis31 mi77
- Yarmouth Port31 mi35
- East Falmouth32 mi35