Crime in Upper Darby, Pennsylvania
Updated ·Vorp Labs
The model puts major crime in Upper Darby at 28% above the U.S. rate per resident: 25% lower for persons crimes and 40% higher for property crimes. Expected major crimes are down 41.4% from a year earlier.
- Modeled from FBI crime data for the police agencies serving Upper Darby. Where an agency didn't report to the FBI, its totals are estimated from its past reports or similar agencies.
- The model estimates about 22.0 major crimes per 1,000 residents a year (2.4 violent, 19.6 property), against 17.2 for the U.S.
- By the model's major-crime rate per resident, Upper Darby is higher than 81% of the 478 other Pennsylvania places and 76% of the 8,446 other places nationwide on CrimeMetric.
Where these numbers come from
The estimates start from what police agencies report to the FBI, modeled across Upper Darby's 64 census block groups for 85,968 residents. How Pennsylvania residents' crime totals reach the FBI: detailed incident reports for 32.2%, summary counts only for 35.0%, estimates from past reports or similar agencies for 24.9% and no reporting agency of their own for 8.0% (shares of 2020 residents). Sources · Method
- Year: many show an agency's last full FBI year (often two years back). These figures are the model's estimate for the current year, release 2026-11-10.
- Crimes counted: some add simple assault, vandalism or drug offenses to "violent" or "property" crime; here major crime is persons plus property crime, and social disorder is separate.
- Area: an agency's totals cover its jurisdiction, which can differ from the city's limits; these are summed over the block groups inside Upper Darby.
- Scale: a grade or a 1-to-100 score ranks places against each other; a rate per 1,000 residents and an index against the U.S. rate don't.
Rates are the model's estimates of reported crime per 1,000 residents a year. Index: 100 is the U.S. rate per resident; 200 is twice it. How we calculated this
How crime varies across Upper Darby
Half of residents live where the major-crime index is between 72 and 137.
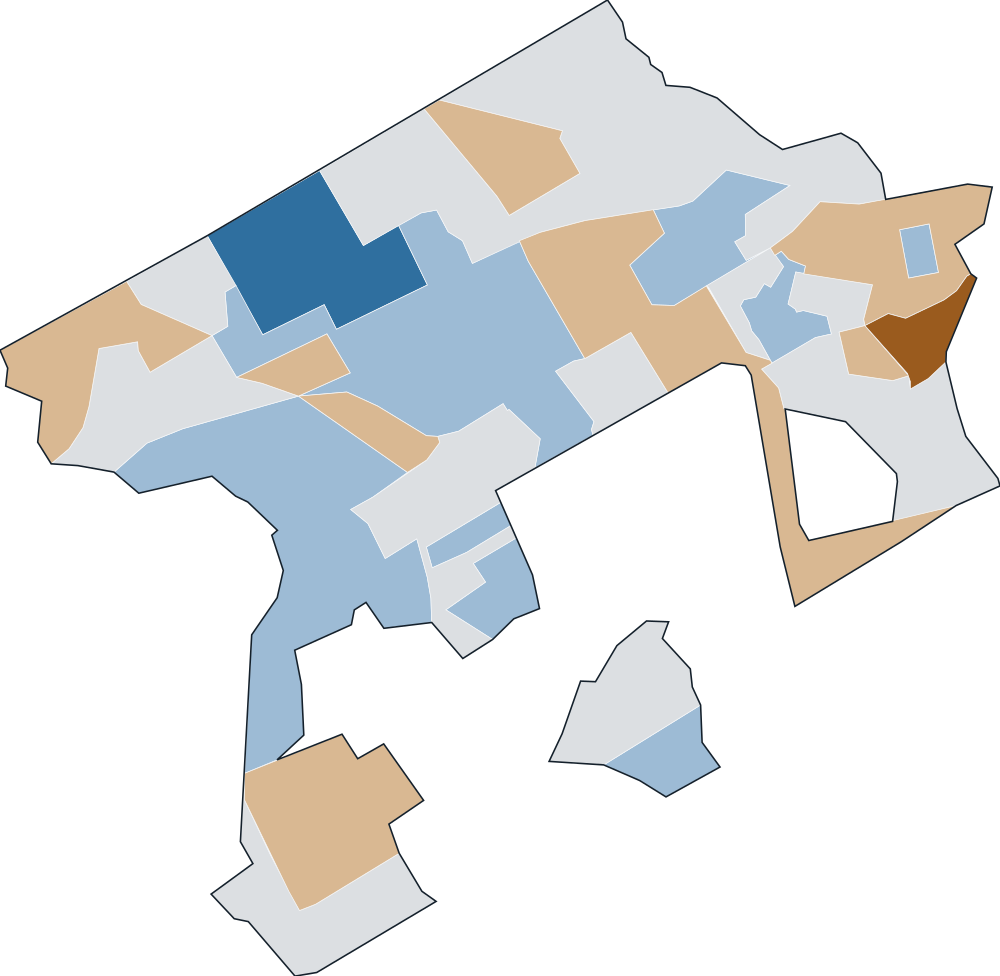
- 0–504.5%
- 50–10035.3%
- 100–20041.8%
- 200–40017.8%
- 400+0.8%
Check an address in Upper Darby
Simple assault stands out most, at 2.8 times the U.S. rate
Citywide indexWhere the middle half of residents live
Property crimes
Social disorder
Highest on weeknights
100 is the U.S. rate, same hours.
Expected major crime fell 41.4% in a year; across Pennsylvania it fell 8.6%
Change in the model's expected crimes, not a count of reports; Pennsylvania in gray. 2031 is a model projection, not tested against past years.
Upper Darby against U.S. places with 50,000 to 100,000 residents
100 of the 580 other places of this size have a major-crime index at least 15% above Upper Darby's, and 97 are within 15% of it; the middle of the group is 91. The 9 nearest in population:
U.S. = 100. Residents in gray.
Upper Darby's major-crime index is higher than 5, lower than 1 and within 15% of 2 of its 8 nearest neighbors
The closest, Lansdowne (1 mi), is 23% below Upper Darby's rate.
U.S. = 100. Miles between population centers.
Questions about crime in Upper Darby
Is Upper Darby safe?
Upper Darby's major-crime index is 128, 28% above the U.S. rate per resident and higher than 81% of the 478 other Pennsylvania places on CrimeMetric: violent crimes against people are 25% below the U.S. rate, and property crimes 40% above the U.S. rate.
What is the crime rate in Upper Darby?
The model expects about 1,890 major crimes a year in Upper Darby, about 22.0 per 1,000 residents, 28% above the U.S. rate.
Is crime going up or down in Upper Darby?
Expected major crimes in Upper Darby are down 41.4% from a year earlier; across Pennsylvania they're down 8.6%.
What are the most common crimes in Upper Darby?
By the model's expected count, the most common crimes against people and property are other larceny (about 735 a year), shoplifting (about 301 a year) and theft from vehicle (about 292 a year).
Are car break-ins common in Upper Darby?
The model expects about 292 thefts from vehicles a year in Upper Darby, 28% above the U.S. rate per resident.
Are car thefts common in Upper Darby?
The model expects about 292 motor vehicle thefts a year in Upper Darby, 2.1 times the U.S. rate per resident.
Is Upper Darby safe at night?
The model's major-crime index is 150 on Sunday to Thursday nights from 6pm to 6am, against 127 at its highest in the daytime; 100 is the U.S. rate for the same hours. That's a citywide estimate per resident for those hours: it can't speak to a particular street, venue or evening. For one address, use the address lookup on this page.
Is crime in Upper Darby higher than the Pennsylvania average?
Upper Darby's major-crime index is 128, 1.5 times the Pennsylvania rate per resident. Pennsylvania as a whole is 84, where 100 is the U.S. rate.
How does crime in Upper Darby compare with Lansdowne?
Lansdowne, 1 mile away, has a major-crime index of 99, 23% below Upper Darby's rate per resident. Upper Darby's is 128.
How we calculated this
Each police agency's crimes, as reported to the FBI or estimated where it didn't report, are spread across the census block groups it serves using population, jobs, points of interest and, where available, local incident records. Upper Darby's figures add up its 64 block groups. The index compares crimes per resident with the U.S. rate.
- Upper Darby has no published incident records in our data, so its estimate relies on agency totals and neighborhood characteristics.
- Rates are per resident, so places where many people work or visit but few live, such as downtowns, airports and stadiums, can read high.
- Disorderly conduct and trespassing are modeled, because the FBI records them only through arrests.
- Residents: 85,968. Model updated Nov 10, 2026. Release 2026-11-10
Full method and validation·Data sources
CrimeMetric. "Crime in Upper Darby, Pennsylvania." Vorp Labs, updated November 9, 2026 (model Nov 10, 2026). https://crimemetric.com/pa/upper-darby
Quote this page's aggregate figures with a link to it. Data terms
Use these numbers in your product
Any U.S. address by API or MCP, free for 10,000 lookups a month.
Get a free API keyNearest cities we publish
Major-crime index, U.S. = 100
- Lansdowne1 mi99
- Drexel Hill1 mi94
- Clifton Heights2 mi91
- Yeadon2 mi119
- Darby2 mi159
- Penn Wynne3 mi62
- Collingdale3 mi129
- Haverford3 mi53